Data Visualization and Storytelling Through Data 
Last date for registration: 09 Jun, 2023
End Date : 21 Jun, 2023
Early Bird Discount Date : 29 May, 2023
Residential Early Bird Fee(excluding GST) : Rs. 94,500
Non-Residential Fee(excluding GST) : Rs. 90,000
Non-residential Early Bird Fee(excluding GST) : Rs. 81,000
Programme Overview
In the current world where everything is digitalized, there is so much of data which gets captured around us. So how do we comprehend this big data and extract valuable, actionable insights and explain this data effectively to stakeholders? As the saying goes “A Picture is worth a thousand words”, Visuals are powerful drivers for conversations. Visualizations can help us make sense of the data. Data storytelling is an about presenting data in a way to aid business decisions The best data stories are insightful, compelling and inspire the audience to take action.
A data storytelling approach gives the managers the ability to visualize the insights you derive from your data science problem. Data analysis is useless for you and your business if you do not know how to present the insights to your key stakeholders to make better business decisions. If we can't tell a compelling story with the data, no one will act on our analysis. In this course, we will discuss data insights through visuals and show how to make those visuals compelling and easy to understand through a series of real-world examples.
Programme Objective
This course is designed to give participants a solid grounding in fundamental data visualization data storytelling learning concepts. This course is spread across 3 days and will have a plenty of hands-on exercises using real world datasets.
Programme Content
• Introduction to Visualization: Need to visualize data and how visualization can be an essential tool for exploring and communicating complicated information. Seven stages of data visualization and various types of charts like comparison, distribution, composition, and relationship. Exploratory and Explanatory analysis.
• Visual best practices: Edward Tufte’s visual encoding. Conversion of data into visualizations to draw valuable insights.
• Visualization of Numerical Data: Choosing right chart for the data on hand. Data analysis as a dashboard to provide narrative and communicate the results.
• Visualization of Text data: Visualization and the challenges of handling text data. How we use chart types such as word clouds, scatterplots, histograms, line charts etc. to visualize a document. Topic models, word embedding, and creating visualizations with bubble charts, bar charts, and t-SNE clusters.
• Visual Storytelling: – Why story telling matters and the science of storytelling. Various types of visual storytelling techniques and the pitfalls of traditional presentation methods. We will also learn about how businesses are adapting various presentation techniques like Pecha-Kucha, Presentation Zen to improve their communication among professionals and how these techniques allow them to weave a story around their presentation to make them more thoughtful, engaging, and interesting to the audience.
• Story telling framework: Types of narratives: author-driven narratives and reader-driven narratives. Seven different types of story types and how to create a narrative around a data science problem through visualization.
• Misleading with charts: how bad visualization can be misleading in decision making.
Key Benefits/Takeaways:
The participants will understand the importance of visualization and storytelling in business communication and learn how to communicate effectively using data visualization.
Pedagogy
Combination of lectures, hand-on sessions and case discussions will be used during the course.
Who Should Attend
Leaders, decision makers and managers involved in business communication and communication with stakeholders of the organization will immensely benefit from the course. Knowledge of business analytics and data science is not necessary to participate in this course.
Programme Fee
INR 1,05,000/- Residential and INR 90,000/- Non -Residential (+ Applicable GST) per person for participants from India and its equivalent in US Dollars for participants from other countries.
Early Bird Discount
Nominations received with payments on or before 29-May-23 will be entitled to an early bird Discount of 10%.
Early Bird Fee (Residential) INR 94,500/-(+ Applicable GST)
Early Bird Fee (Non-Residential) INR 81,000/-(+ Applicable GST)
Group Discount
Group Discount of 5% percentage can be availed for a group of 3 or more participants when nominations received from the same organization.
Please Note
All enrolments are subject to review and approval by the programme director. Joining Instructions will be sent to the selected candidates 10 days prior the start of the programme.
The programme fee should be received by the Executive Education Office before the programme commencement date.
In case of cancellations, the fee will be refunded only if a request is received at least 15 days prior to the start of the programme.
If a nomination is not accepted,the fee will be refunded to the person/ organisation concerned.
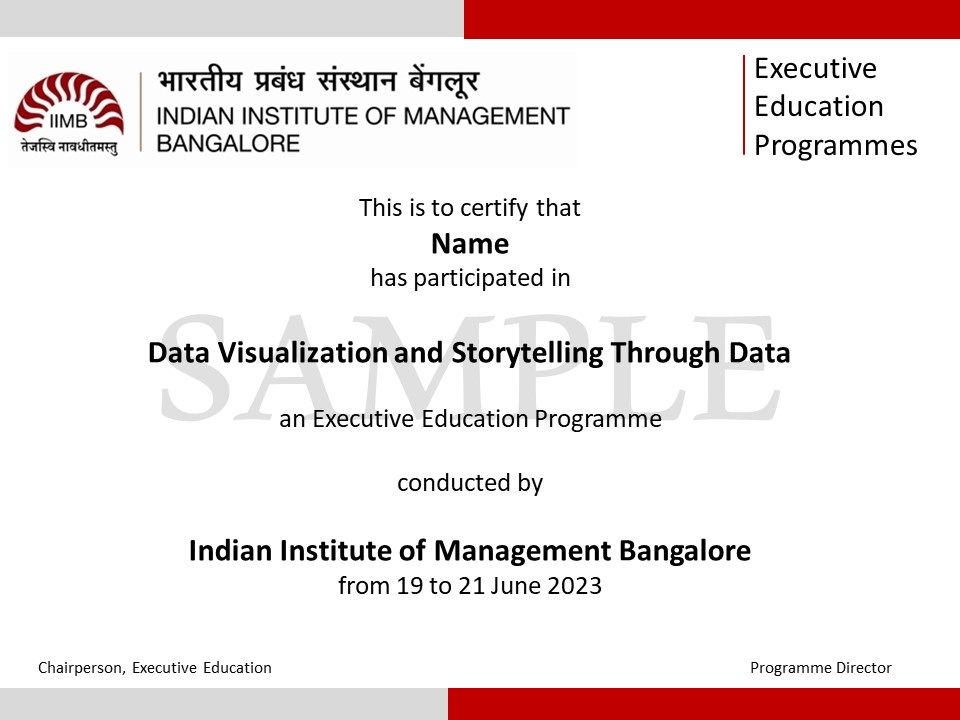
A certificate of participation will be awarded to the participants by IIMB.
Programme Directors
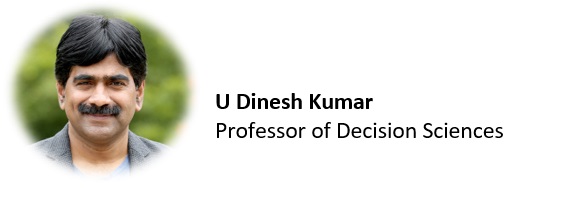
U Dinesh Kumar is a Professor of Decision Sciences at IIM Bangalore and Chairperson of MBA (Business Analytics), he is also IIMB chair of excellence since January 2020. He holds a Ph.D. in Mathematics from IIT Bombay. Dr Dinesh Kumar introduced Business Analytics elective course in 2008 to the PGP students at IIM Bangalore and started one of the first certificate programs in Business Analytics in India in 2010.
Dr Dinesh Kumar has over 25 years of teaching and research experience. Prior to joining IIM Bangalore, Dr Dinesh Kumar has worked at several reputed Institutes across the world including Stevens Institute of Technology, USA; University of Exeter, UK; University of Toronto, Canada; Federal Institute of Technology (ETH), Zurich, Switzerland; Queensland University of Technology, Australia; Australian National University, Australia and the Indian Institute of Management Calcutta.
Dr Dinesh Kumar has published more than 70 research articles in leading academic journals. Forty of his case studies on Business Analytics based on Indian and multinational organizations such as Aavin Milk Dairy, Apollo Hospitals, Bigbasket, Bollywood, Eureka Forbes, Fantasy Sports, Flipkart.com, Hewlett and Packard, iD Fresh Foods, ISKCON, Jayalaxmi Agro Tech, Larsen & Toubro, Manipal Hospitals, Mission Hospital, Hindustan Aeronautics Limited, Indian Premier League, Reliance Retail, Shubham Housing Finance Limited, VHS Blood Bank, VMWare have been published at the Harvard Business Publishing’s (HBP) case portal. Nine of his case studies are best sellers at (HBP). His case studies are used by more than 220 Institutions across 70+ countries across the world. He has authored 5 books, his recent book is titled, “Business Analytics – The Science of Data Driven Decision Making”, published by Wiley in 2021 is an Amazon Best Seller. He co-authored a book titled, “Machine Learning Using Python”, with Mr Manaranjan Pradhan, published by Wiley in 2019.
Dr Dinesh Kumar has carried out predictive and prescriptive analytics consulting projects for organizations such as The Boston Consulting Group (India) Private Limited, Kimberly Clark, Cartesian Consulting, GE Healthcare, Group One Holding Pvt Ltd, Hindustan Aeronautics Limited, Qatar Airways, Mission Hospital, Manipal Hospitals, Scalene Works, SMNet Serve, TVS Motors, Wipro Limited, UNIBIC and the World Health Organization etc.
Dr Dinesh Kumar has conducted training program on Analytics for several companies such as Accenture, Aditya Birla Group, Ashok Leyland, Asian Paints, Bank of America, Blue Ocean Market Intelligence, Cisco, Fidelity, Hindustan Aeronautics Limited, Honeywell, Infosys, ITC Info Tech, Madya Pradesh Agency for Promotion of Information Technology (MAPIT), National Academy for Defence Production, Ocwen financial Services, SONY and so on. Dr Dinesh Kumar conducts corporate training programme in Analytics and trained more than 1000 professionals in the field of analytics.
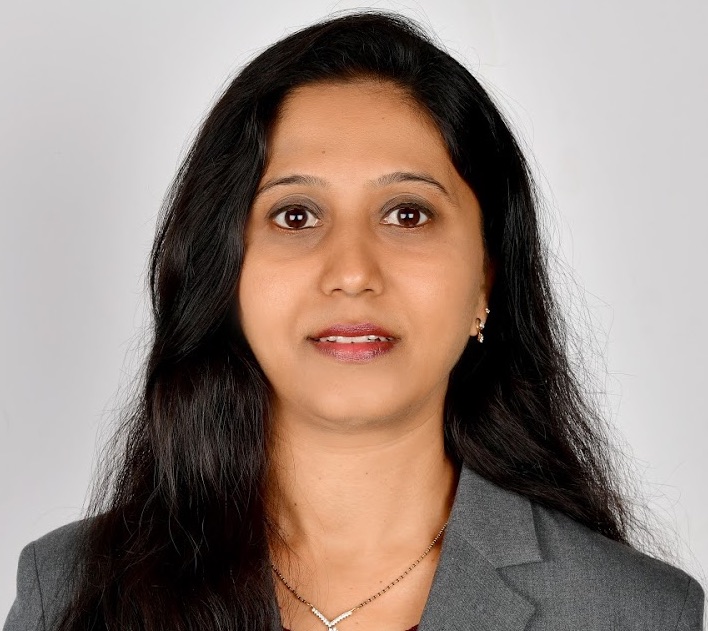
 Sharada Sringeswara
Sharada Sringeswara is an adjunct faculty member at the Indian Institute of Management Bangalore – Data Centre and Analytics Lab (IIMB–DCAL) and Associate Partner at Acuver Consulting Private Limited. She is an alumnus of BITS Pilani and IIMB, with over 20 years of experience in leading IT development organizations. She is a seasoned analytics executive with hands-on and leadership experience in building business models with an understanding of the digital technology landscape. As a data enthusiast, she brings in product leadership by balancing knowledge and experience of data science and software engineering. She has worked with companies like Walmart, Tesco, Sterling Commerce, Wipro, and Future Group. As a consultant at IIMB–DCAL, she has been involved in training and consulting in the field of data science. As an adjunct faculty at IIMB, she is teaching Data Visualization and Storytelling for MBA students. She has also been teaching analytics in both short and long duration faculty development programs at IIMB. As guest faculty at IIM Lucknow, she has been conducting training sessions on CRM and Text Analytics. She has co-authored analytics case in Harvard Business Publishing: Fantasy Sports: A Game of Skill or Chance
How to Apply
.jpg)
Sample Certificate

Note: Certificate image is for reference to potential participants only and may change at the discretion of Executive Education Programmes Office

